How to Customize Display of an Object into Debugger Window - Part 2
There are a number of different ways we can customize the debugging experience for the objects that we create. In this video, we’ll be going to learn that how proxy in the debugger allows us to completely change the way that the type is displayed in the debugger.
This allows us to completely change the way that the type is displayed in the debugger. Let’s take a look at this patient detail object. If we go ahead and run this application, we can see our patient’s name, date of birth, and disease history.
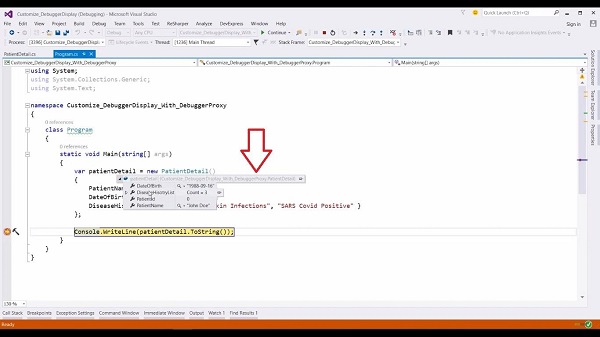
If we wanted to customize this debugger experience, for example, the role of this patient detail such as patient name and date of birth into a single string and disease history as pipe separated string then we can use the debugger type proxy attribute. Define the attribute [DebuggerTypeProxy(typeof(PatientDetailProxy))]. So when we use this attribute, we need to specify the type to be used as the debugger proxy. In our case, it’s a patient detailed proxy. Here, we are saying whenever we display the patient detail class in the debugger, we actually want to use this patient detailed debug proxy class.
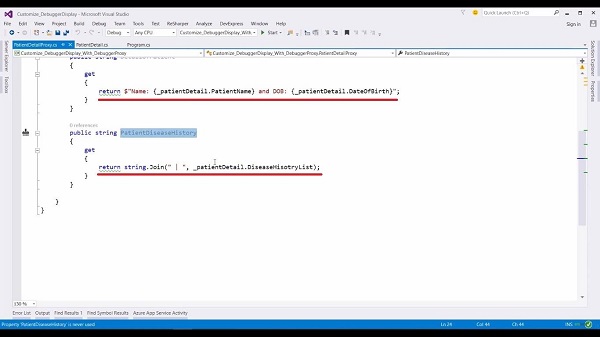
Now let’s go to this class. When we create a class to be used as a debug proxy, we need to specify a constructor that takes an instance of the object that we want to display. Here we are creating a proxy for the patient detail class and assigning this object to an internal field of this class so that we can access it. Now, the first thing we want to do is create this patient detail role up of the name and date of birth. This way, this property is simply returning the name, followed by the date of birth [return $”Name: {_patientDetail.PatientName} and DOB: {_patientDetail.DateofBirth}”]. The second thing we wanted in our debug proxy class is the pipe-separated string of disease history. So that’s our proxy class defined and we have linked it to the main class using the debugger type proxy attribute.
Let’s run this app and see what debug info we have. Now, if I hover over this object and expand it, notice that now we get the information from our proxy class and not the underlying patient detailed class. Here we have our pipe-separated disease history list and our patient details string in this property. These two properties are coming from the proxy class. This is how the debugger type proxy attribute allows us to specify a proxy class to customize the view of the data in the debugger window.
For more videos and articles visit:
Useful Links:
👉 GET YOUR FREE API KEY for PDF.co
https://app.pdf.co/signup?utm_source=youtube
✅ ON-PREMISE SDK FREE TRIAL:
https://bytescout.com/download/web-installer?utm_source=youtube
🔎 SDK DOCUMENTATION:
https://bytescout.com/documentation/