How to Customize Display of an Object into Debugger Window - Part 1
There are a number of different ways we can customize the debugging experience for the objects that we create. In this video, we’ll be going to learn that how proxy in the debugger allows us to completely change the way that the type is displayed in the debugger.
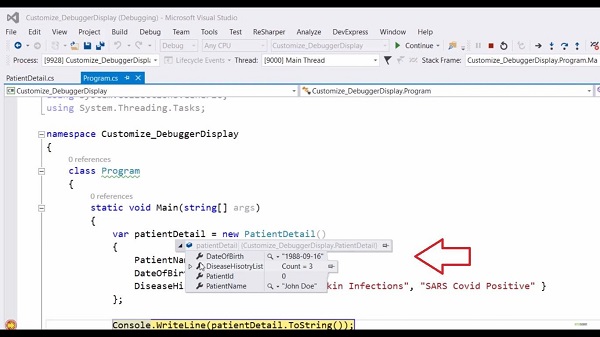
While debugging code over-application can we customize our object property value in the debugger window? In this session, we will explore the different ways of customizing our object property value in the debugger window. Sometimes while debugging our code, it can be useful to have customized output available in the debugger window. In this code, I have defined an object of the patient detail class which contains a fewer getter setter property. Now, when I run this application and hover over this patient detail object, you can see that at the root level, we just get the name of the type. When we expand this down here, we will get the individual property and its value.
Now, let me stop debugging this code. The first way that we can start to take some control of the debugger output is to override the ‘To String’ method in this patient detailed class. So for that, define (public override string ToString(). Instead of this (return base.ToString(); let me return this string which is like (return $”From ToString() : Patient Name - {PatientName} and his disease history list, so here you can see that first we will set the patient name property over here and his release with this pipe sign using string dot joint method.
Run the code and check our object property value. This time when hovering over this object, you can see our customized ‘ToString’ value. This one doesn’t affect the individual members inside this object. The other option we have is to use the debugger display attribute. Instead of this override ‘ToString’ method, we will use the debugger display attribute. Comment out this ‘ToString’ method. In our case, we will be going to apply the debugger display attribute at the class level. In the square bracket, let us define the debugger display attribute. In the parameter, we need to supply a string and within this string, you can reference the member of the class. Now, in this string, to reference the class member, we need to enclose the name of the member in the curly braces which is like [DebuggerDisplay(“FromDebugger attribute - patientName - {PatientName} and his disease history list- {FlattenDiseaseHistory}”)].
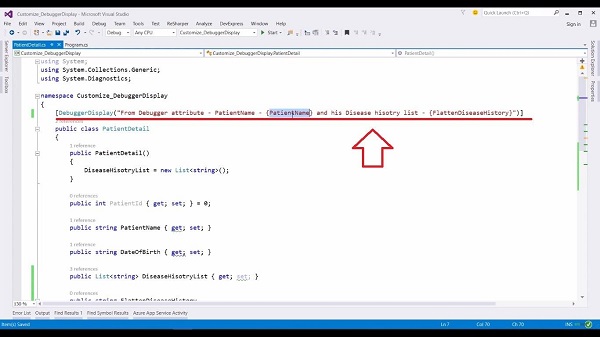
Here patient name property is referring to this (public string PatientName) property name and this flattens disease history is referring to this (public string FlattenDiseaseHistory) property. Let’s run this application again. When I look at the debugger window, we can see that the root level now uses the debugger attribute at the class level. Here we get the patient’s name and his disease history list.
We can also apply this debugger display attribute at the individual property level. We can also use this attribute at class level, struct level, delegates level, and enum level. Whenever you use this debugger display attribute, you should make sure that it actually does increase the clarity at the debug time rather than distract from it.
For more videos and articles visit:
Useful Links:
👉 GET YOUR FREE API KEY for PDF.co
https://app.pdf.co/signup?utm_source=youtube
✅ ON-PREMISE SDK FREE TRIAL:
https://bytescout.com/download/web-installer?utm_source=youtube
🔎 SDK DOCUMENTATION:
https://bytescout.com/documentation/